Application of deep UV resonance raman spectroscopy to bioprocessing
Posted: 20 June 2011 |
In recent years, Raman spectroscopy has been successfully applied to bioprocessing, including industrial processes. Raman studies have typically been aimed at measuring accurately both product yields and the presence of secondary products; including glucose and ethanol levels as well as secondary metabolites present in complex non-fractionated fermentation broths1,2. However, Raman spectroscopy as a tool for monitoring the complex structural changes occurring during protein production has to date been under utilised, particularly the use of the extremely sensitive structural technique of UV resonance Raman (UVRR) spectroscopy.
The biopharmaceutical market, although currently a relatively small percentage of conventional pharmaceuticals, continues to expand with predicted revenues of over USD 100 billion for 20103-5. With continual demand for high fidelity products, from recombinant therapeutic proteins to nucleic acid-based medicinal products, the need for reliable, cost effective and appropriate analytical techniques for assessing the conformity of the products is still paramount3,5.
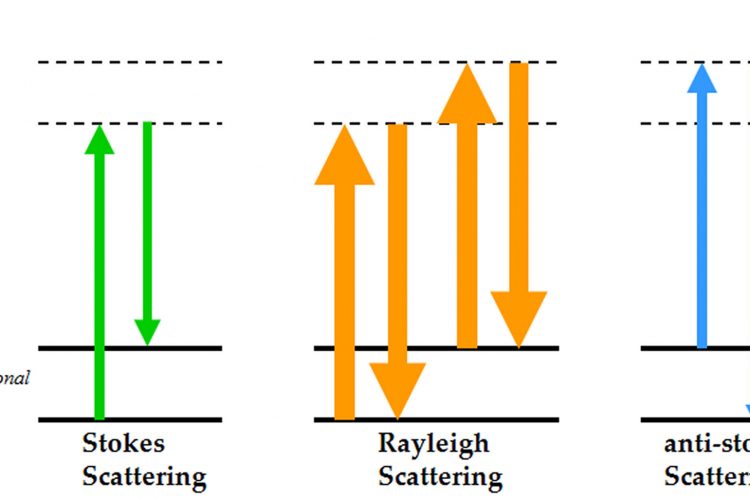
Figure 1 Energy level diagram of Rayleigh and Raman scattering
In recent years, Raman spectroscopy has been successfully applied to bioprocessing, including industrial processes. Raman studies have typically been aimed at measuring accurately both product yields and the presence of secondary products; including glucose and ethanol levels as well as secondary metabolites present in complex non-fractionated fermentation broths1,2. However, Raman spectroscopy as a tool for monitoring the complex structural changes occurring during protein production has to date been under utilised, particularly the use of the extremely sensitive structural technique of UV resonance Raman (UVRR) spectroscopy.
The biopharmaceutical market, although currently a relatively small percentage of conventional pharmaceuticals, continues to expand with predicted revenues of over USD 100 billion for 20103-5. With continual demand for high fidelity products, from recombinant therapeutic proteins to nucleic acid-based medicinal products, the need for reliable, cost effective and appropriate analytical techniques for assessing the conformity of the products is still paramount3,5. Monitoring of these complex processes is important for accurate assessment of product yield and quality control, but is also necessary to gain a greater knowledge of both the chemical and physical changes that occur. Increased biological understanding of the cellular processes can further facilitate bioprocess design and ultimately improve both quality and quantity of the product, particularly if real-time and on-line information can be collected5. The confocal nature of Raman spectroscopy and the fact that water has only a weak Raman scatter means that Raman measurements can be taken of solutions directly through transparent materials, such as the side of a reaction vessel. Furthermore, with continuing advancements in spectroscopic instrumentation reducing size and cost as well as improved software capabilities, Raman spectroscopy is extremely applicable to both on-line and real time monitoring.
Just over a decade ago, Shaw et al. demonstrated that Raman spectroscopy could be successfully applied to the on-line monitoring of the biotransformation by yeast of glucose to ethanol1. The results showed that with an appropriate on-line set-up and specifically designed software for data preprocessing and multivariate analysis, glucose and ethanol concentrations could be measured with over five per cent accuracy (compared to off-line chemical and enzymatic diagnostic methods). Further work, comparing a diverse range of unprocessed, industrial fed-batch fermentation broths containing the fungus Gibberella fujikuroi also successfully applied Raman spectroscopy and appropriate chemometric models to measure accurately the concentration of natural product gibberellic acid2. Raman spectroscopy has also been used to evaluate the nature of particle contamination detecting micro-particles inside glass containers such as glass syringes, vials and test tubes6. However, the structural sensitivity of Raman gives it the potential for being far more than just a technique to measure product / biproduct / substrate concentrations and the presence of any contaminants.

Figure 1 Energy level diagram of Rayleigh and Raman scattering
The principle of Raman spectroscopy is depicted by the electronic level diagram shown in Figure 1. When incident photons interact with a molecule, they can induce a transition in energy states that leaves the molecule in an excited vibrational state with a corresponding loss of energy in the photon7. Most of the scattered photons from the molecule have the same energy as the incident light referred to as Rayleigh (elastic) scattering, whilst a small fraction of the photons are scattered at different frequencies, referred to as Raman (inelastic) scattering. This difference in scattered frequencies, or Raman shift, is measured in units of cm-1 (wavenumbers which is equal to 1/wavelength of the Raman shift). The frequency of the Raman scattered photon can be either less than the incident frequency (Stokes scattering) or greater than the incident frequency (anti-Stokes scattering). Conventionally it is the Stokes scattering that is usually measured, as this is the more common phenomenon giving higher Raman intensities. What makes this technique a valuable probe in the investigation of biomolecules is that the measured Raman spectrum contains a large amount of structural information as there are 3N-6 vibrational modes, where N is the number of atoms, for a nonlinear molecule7. A typical Raman spectrum of proteins in aqueous solution can be divided into regions correlating to different vibrational modes which identify both backbone structure and side chain environments, as listed in Table 1. By monitoring local environments, hydrogen bonding orientation and interactions of side chains such as aromatics and disulphide bonds information on protein stability can be determined. Information on side chain stability combined with conformational details of secondary structure elements, particularly α-helical and β-sheet structure, makes Raman a powerful technique for studying the behaviour of biological systems.
Table 1 Raman band frequencies with their corresponding vibrational mode and protein structure assignments
| Band frequency (cm-1) | Region | Vibrational mode | Protein structure assignments |
| 870-1150 | backbone, skeletal stretch | Ca-C, Ca-Cb, Ca-N | secondary structure elements: a-helix, b-sheet, less-ordered structure |
| 1200-1340 | amide III | N-H in plane, Ca-N stretch | hydrogen bonding, secondary structure |
| 1400-1480 | side chain deformations | CH2 and CH3 deformations | local environments, intermolecular interactions of side chains |
| 1510-1580 | amide II | N-H deformations and C-N stretch, (observed in UVRR and not conventional Raman spectra) | local environments, intermolecular interactions of side chains |
| 1630-1700 | amide I | C=O stretch NH in-plane bending | secondary structure elements: a-helix, b-sheet, less-ordered structure |
A further advantage of applying Raman spectroscopy to biological processes is that any single wavelength from deep UV to near infrared can be used to excite a sample, and the choice of the light source is only limited by the availability of the laser emission line8. This advantage means the most appropriate excitation wavelength can be applied for a specific investigation. The chosen excitation wavelength is often determined by a need to compromise between reducing sample fluorescence and scattering power; the two major challenges of Raman spectroscopy. Raman scattering is typically a weak signal with approximately only one in every 106-108 photons being elastically scattered and consequently, fluorescence, which is emitted from biological samples, can mask the Raman signal7. Due to the inverse fourth power dependence of Raman scattering efficiency on wavelength scattering power increases with decreasing wavelength; however, fluorescence also increases with decreasing wavelength8. Investigations of biomolecules are often carried out with excitation wavelengths at ~532, 633 and 785 nanometres. At 532 and 633 nanometres, it has been shown to give etailed spectra of biomolecules, particularly conformation changes in proteins and structures involving iron-binding, respectively9-11. Nevertheless, biological spectra at these wavelengths can still be plagued with large amounts of fluorescence. Moving to an excitation wavelength of 785 nanometres or above, although slightly reducing scattering efficiency compared to 532 and 633 nanometres, also reduces fluorescence, as demonstrated by the previously discussed bioprocessing Raman studies1,2. Alternative wavelengths for Raman spectroscopy are found in the deep UV ranging from 180-260 nanometres. UV excitation wavelengths not only remove fluorescence, as no florescence interference exists at wavelengths below 250 nanometres, but can also enhance the signal by a factor of 103-105 over conventional Raman scattering through the resonance Raman effect. In resonance Raman (RR) spectroscopy if the energy of the incident laser is within the molecular absorption bands of chromophores or aromatics in the molecules then the signal from these molecules is enhanced7. With UVRR resonance enhancement results in a protein spectrum dominated by amide vibrations and aromatic amino acids bands.
Figure 2 demonstrates the structural sensitivity of UVRR to protein structure, comparing spectra of different proteins; lysozyme, α-lactalbumin, β-lactoglobulin and a monoclonal antibody, collected for 60 seconds at an excitation wavelength of 244 nanometres. As can be observed from the inserted structural cartoons α-lactalbumin and lysozyme are similar in structure with approximately 40-44 per cent α-helical structure and 10 – 11 per cent β-sheet. β-lactoglobulin has far more β-structure (~40 per cent) and although the complete structure of the majority of specific IgG monoclonal antibodies remain undetermined, based on the structure of the intact monoclonal antibody shown in Figure 2 (Protein Data Bank 1IGT), and numerous crystal studies of antibody fragments, the majority of the secondary structure is β-sheet (~ 46 per cent). The percentage of β-sheet is reflected in the amide I region in Figure 2, with a shoulder at ~1668 cm-1 observed only in the β-lactoglobulin and the antibody spectra (which shows additional structure in this region). As previously discussed, one of the key advantages of UVRR spectroscopy is its sensitivity to aromatic side chains, in particular tyrosine and tryptophan. In β-lactoglobulin, α-lactalbumin and lysozyme there is very little difference in the reported numbers of these residues, all three proteins having 3 tyrosine’s, with increasing tryptophan numbers from 2 to 4 to 6, respectively. However, in Figure 2 spectral variations can be observed in bands that are due to tryptophan vibrations occurring at 1360, 1555 and 1614 cm-1. A change in peak position of the bands that arise from ~1612-1620 and 1550-1555 cm-1 can also be observed due to differences in solvent exposure of the tryptophan residues. Despite having similar structures the position and therefore local environment of the tryptophan residues is different between α-lactalbumin and lysozyme as reflected in the UVRR spectra. Although UVRR has less Raman features than conventional Raman spectra, the sensitive amino acid bands make it an excellent technique for investigation of relatively small structural differences.

Figure 2 UVRR protein spectra of lysozyme, α-lactalbumin and β-lactoglobulin in water and a monoclonal antibody in buffer. All spectra were collected for 60 seconds with an excitation wavelength of 244 nanometres. Inserts are of cartoon representations of the protein structure drawn with PyMol (Delano Scientific, Palo Alto, CA) from the Protein Data Bank (PDB) atomic coordinates (lysozyme 1LSE, α-lactalbumin 1HFZ and β-lactoglobulin 1BEB, monoclonal antibody 1IGT)
Smith and colleagues demonstrated that UVRR spectroscopy could be used to monitor protein unfolding when coupled to microfluidics for sensitive modifications of the local environment12,13. These studies used model E colicin-binding immunity proteins and showed that the local environment of tyrosine and tryptophan changed during unfolding and that the information gained from UVRR was complementary to fluorescence spectroscopy and offered new information on the environments of these aromatic amino acids. In a more biopharmaceutical-related study, Wen et al. conducted work on the conformation and local environments of recombinant human interleukin-1 receptor antagonist using several Raman techniques and applied UVRR to investigate side chain environments14. From analysis of the UVRR spectra, these authors were able to determine that both the tyrosine and tryptophan residues were in hydrophilic environments and not involved in cation-π interactions recognised as playing important role in protein structural stability. Further UVRR studies focusing on changes in the amide III vibrations of peptides suggested that small frequency shifts can be used to monitor the hydrogen bonding of C=O and N-H sites, determining whether these hydrogen bonds occur due to water or to other peptide bonds, further extending the potential of UVRR spectroscopy for investigating protein stability15.
UVRR spectroscopy, along with con – ventional Raman, also has the advantage of being sensitive to nucleic acids, and therefore DNA and RNA structure. Raman spectroscopy investigations of nucleic acids have shown that not only can bases, base interactions and backbone phosphate conformations be identified but also that complexes between RNA and proteins can be analysed16,17. Our previous work investigating the concentration effect of antibodies on bacterial cells demonstrated how UVRR spectroscopy can be applied to investigations of both changes in amino acids and nucleic acids18. Figure 3 shows the spectra of the opportunistic pathogenic bacteria Pseudomonas aeruginosa grown with no antibiotic and with increasing concentrations of the antibiotic amikacin. Amikacin is an aminoglycoside which inhibits protein synthesis by binding to the bacterial 30S ribosomal subunit involved in peptide synthesis. Spectral variations can be observed in bands arsing from both amino acids tryptophan and tyrosine (~1607 and 1360 cm-1) and nucleic acids adenine and guanine (~1570, 1475 and 1330 cm-1). With further analysis using appropriate chemometric techniques it was determined that the protein related bands decreased while the intensity of nucleic acid bands increased with increasing concentration of amikacin. Consequently, the UVRR spectral set successfully monitored the mode of action of amikacin on P. aeruginosa. The structural sensitivity of UVRR and other Raman techniques for not only protein but also RNA and DNA structure makes it an ideal tool for the investigation complex biomolecular interactions.

Figure 3 UVRR spectra of P. aeruginosa grown in the presence of various amikacin concentrations. Taken from Lόpez-Díez et al.18
Despite Raman spectroscopy being applied to fundamental studies of proteins (and nucleic acids) for over four decades its use for determining structural changes during bioprocessing has been under utilised. Traditionally, Raman spectroscopy has been hampered by its weak signal and low instrument sensitivity, thereby requiring large protein concentrations (20-50 mg/ml) and samples to be run for long periods in order to acquire a strong enough signal with limited fluorescence7,8. The high price of instrumentation and difficulties in process interfacing have also limited its application to biopharmaceuticals. In recent years, vast improvements in Raman instrumentation have occurred, including better lasers, optics, CCD cameras and data processing. As a result, instruments are now far more sensitive and range in size, cost and sensitivity resulting recently in the production of affordable, portable Raman spectrometers with options for fibre optic probes and programming for specific tasks. Although the size of a UV laser at present, plus cost and complexity of the specialised instrumental set up, rules out its on-line application by exploiting the structural detail available, valuable advances can be made in the understanding of structural changes occurring during biopharmaceutical production. The main challenge of Raman spectroscopy today is that its actual structural sensitivity combined with the fact the technique is holistic, giving an overall fingerprint of the complete sample, results in data containing large amounts of information. By combining information from both on-line and off-line Raman analysis, and from different Raman spectroscopes including UVRR, a better understanding of complex biophysical changes during bioprocessing can be gained. With continued comprehensive and high-quality development of Raman spectroscopic methods for monitoring complex biopharmaceutical production, Raman spectroscopy has real potential as a reliable, rapid and cost effective on-line process analytical technique.
Acknowledgements
We are very grateful to the UK BBSRC, EPSRC, Avacta group plc. and industrial members of the Bioprocessing Research Industry Club (BRIC) for funding.
References
- Shaw, A. D., Kaderbhai, N., Jones, A., Woodward, A. M., Goodacre, R., Rowland, J. J. and Kell, D. B. (1999). Appl. Spectrosc. 53, 1419-1428
- McGovern, A. C., Broadhurst, D., Taylor, J., Kaderbhai, N., Winson, M. K., Small, D. A., Rowland, J. J., Kell, D. B. and Goodacre, R. (2002). Biotechnol. Bioeng. 78, 527-538
- Rosa, P. A. J., Ferreira, I. F., Azevedo, A. M. and Aire-Barros, M. R. (2010). J. Chromatogr. A 1217, 2296-2305
- Morris, S. (2008). Int. Suppl
- Ündey, C., Ertunc, S., Misstretta, T. and Looze, B. (2010). J. Process Control 20, 1009-1018
- Cao, X., Wen, Z.-Q., Vance, A. and Torraca, G. (2009). Appl. Spectrosc. 63, 830-834
- Smith, E. and Dent, G., (2005) Modern Raman Spectroscopy a practical approach John Wiley and Sons, West Sussex, England
- Wen, Z.-Q. (2007). J. Pharm. sci 96, 2861-2878
- Ashton, L., Dusting, J., Imomoh, E., Balabani, S. and Blanch, E. W. (2010). Biophys. J. 98, 707-714
- Ashton, L. and Blanch, E. W. (2010). J. Mol. Struct. 974, 132-138
- Wood, B. R., Tait, B. and McNaughton, D. (2001). Biochim. Biophys. Acta 1539, 58-70
- Rodriguez-Mendieta, I. R., Spence, G. R., Gell, C., Radford, S. E. and Smith, D. A. (2005). Biochemistry 44, 3306-3315
- S, I. M., I, R., Rodrigues-Mendieta, Friel, C. T., Radford, S. E. and Smith, D. A. (2006). Rev. Sci. Instrum 77, 055105
- Wen, Z.-Q., Cao, X. and Vance, A. (2008). J. Pharm. sci 97, 2229-2241
- Mikhonin, A. V. and Asher, S. A. (2006). J. Am. Chem. Soc. 128, 13789-13795
- Benevides, J. M., Overman, S. A. and G. J. Thomas, J. (2005). J. Raman Spectrosc. 36, 279-299
- G. J. Thomas, J. (1999). Annu. Rev. Biophys. Biomol. Struct. 28, 1-27
- Lόpez-Díez, E. C., Winder, C. L., Ashton, L., Currie, F. and Goodacre, R. (2005). Anal. Chem 77, 2901-2906